Monitoring
Metrics with Kamon
You’ll find the kamon configuration file within the resources/metrics folder (kamon.conf). It contains instrumentation configuration including filters for which elements metrics shall be collected as well as the configuration for the exposed server providing the status page mentioned above.
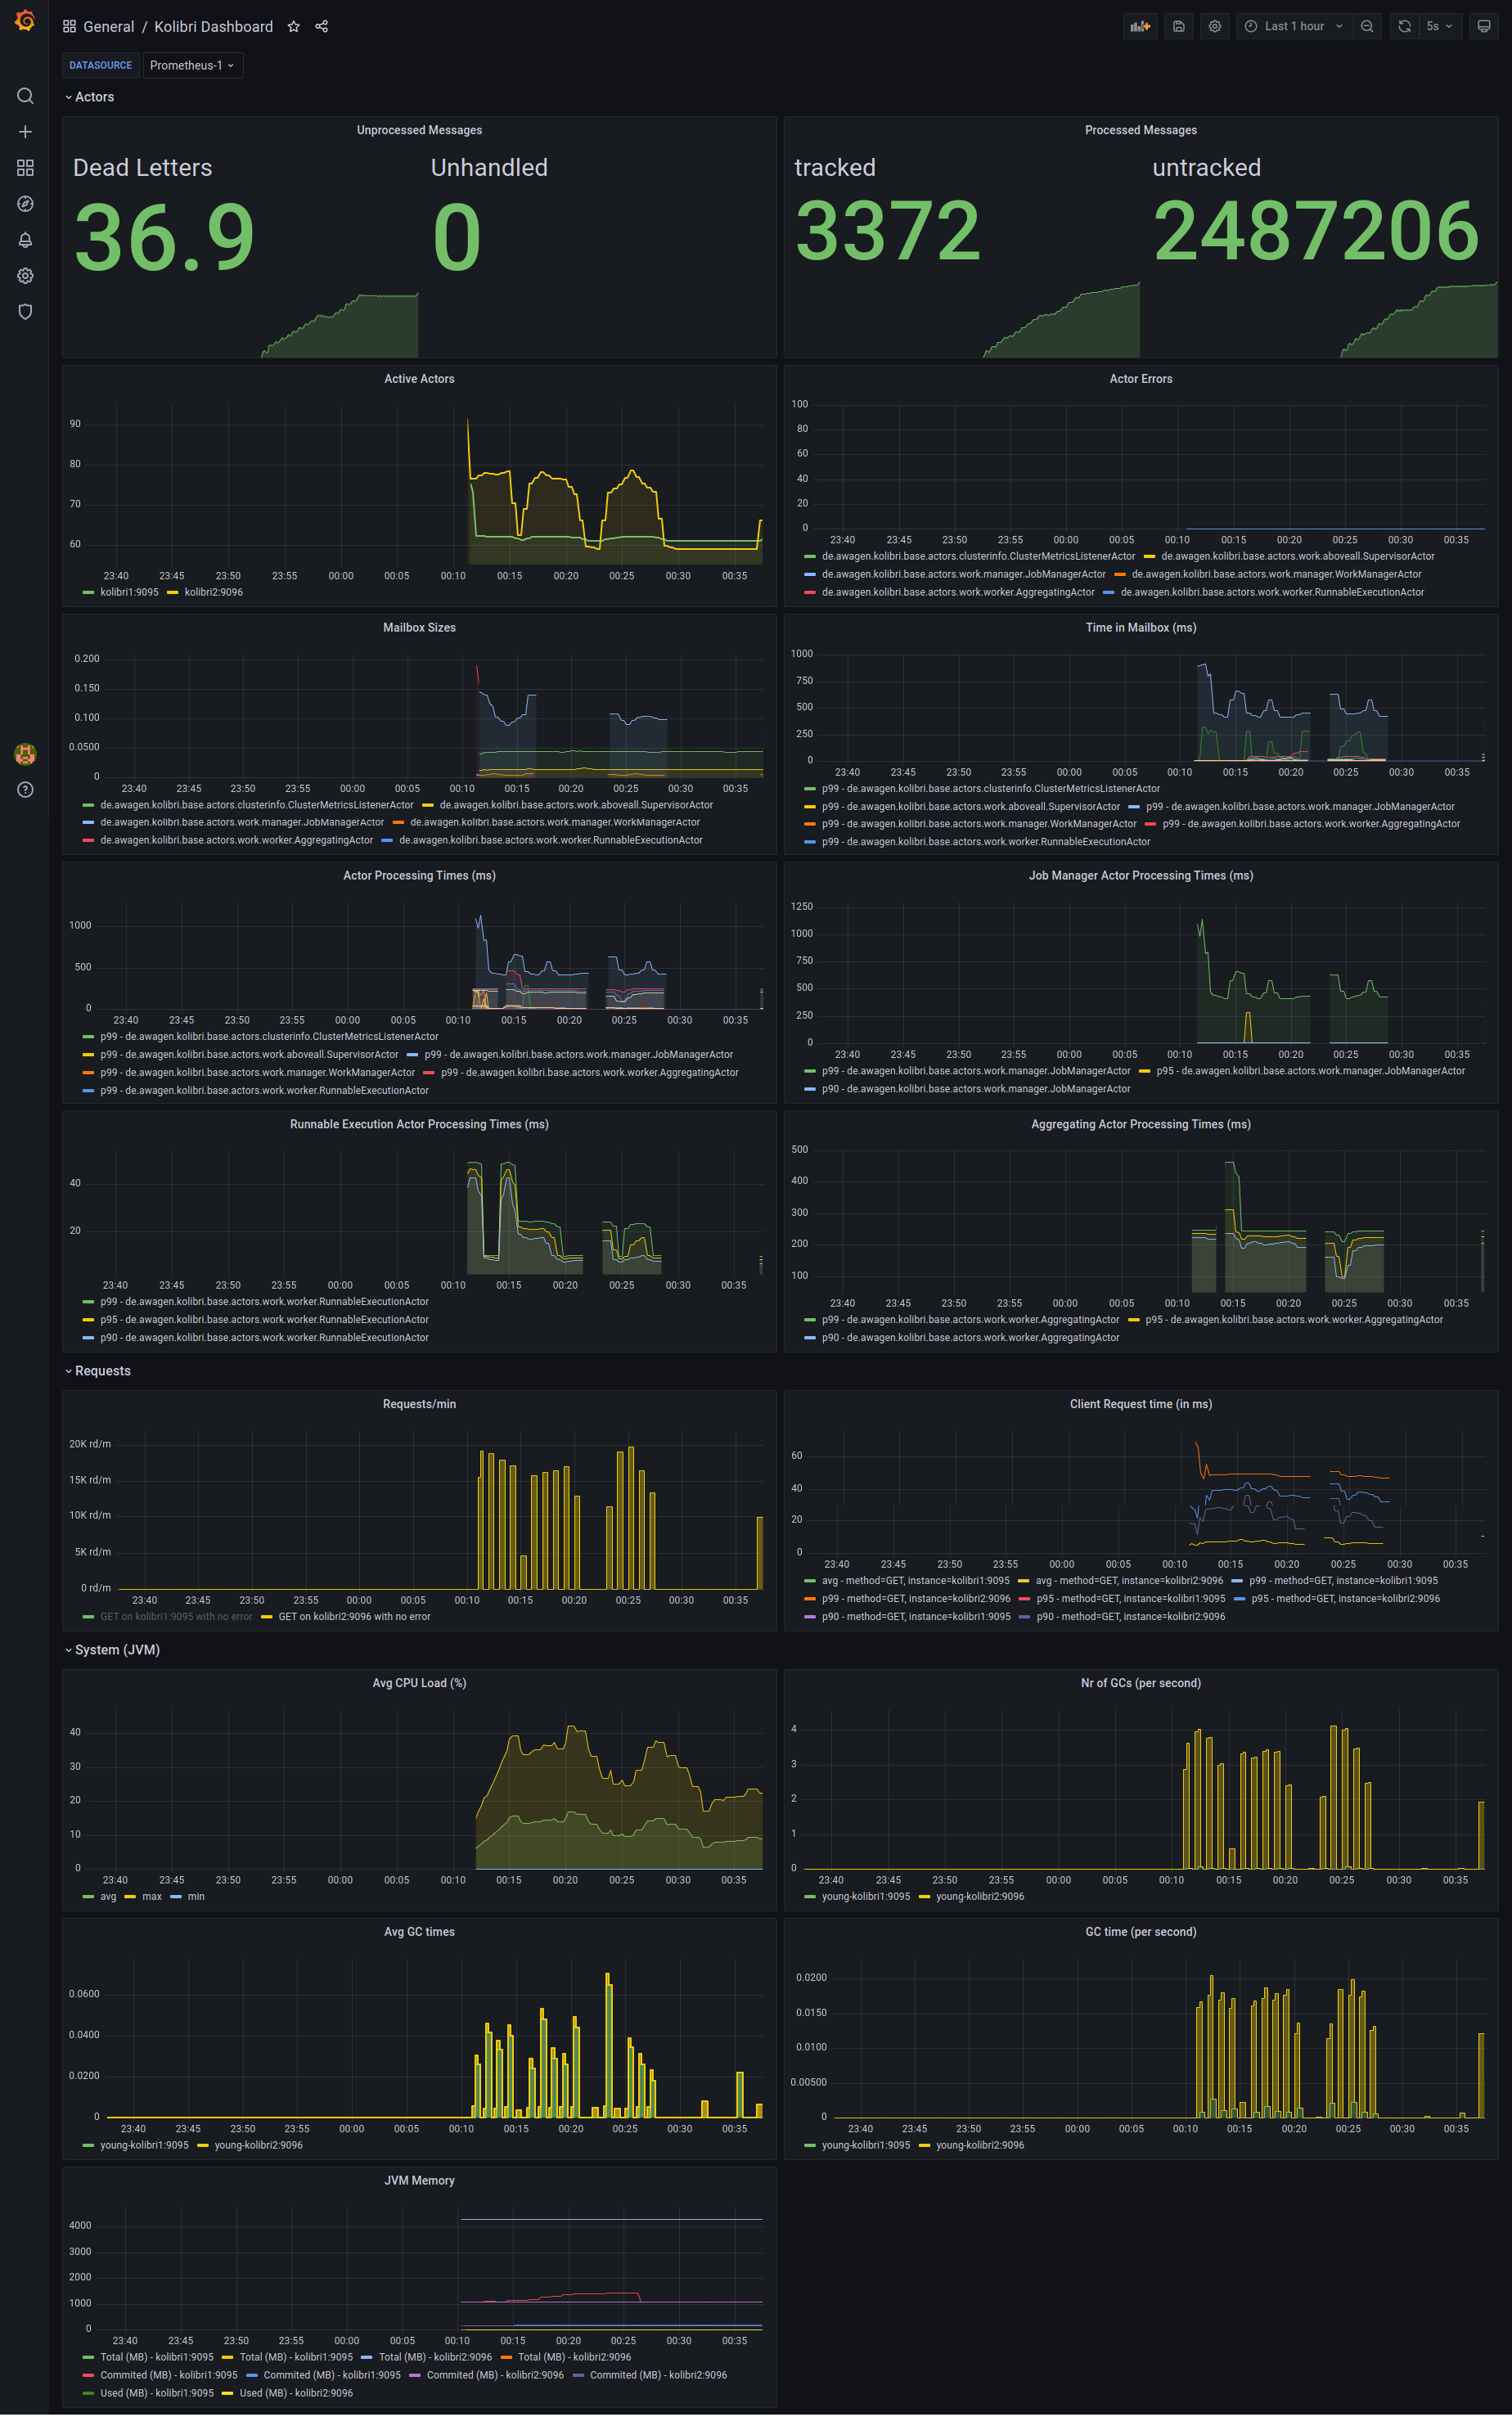
An example dashboard can be found in the grafana/dashboards folder. It provides general metrics regarding system performance. The below provides a description of the distinct displays in the example dashboard, for screenshot of the dashboard see below.
| Metric Display | Meaning |
|---|---|
| Dead Letters | Messages that could not be delivered to the actor they were sent to. This can be normal, e.g in case the is a shutdown message sent but actor already shut down or similar. If happening in unexpected cases, they might indicate a problem with the workflow. |
| Unhandled | Messages sent that were received but not handled (e.g were missing handling in the receive function of the receiving actor) |
| tracked | Processed and tracked messages (tracked as per kamon.conf filters) |
| untracked | Processed but untracked messages (untracked as per kamon.conf filters) |
| Active Actors | Nr of active actors per node |
| Actor Errors | Nr of errors per actor class |
| Mailbox Sizes | Mailbox size per actor class. Refers to the nr of messages in the mailbox queue waiting to be processed. If this number increases in an actor critical for processing this might indicate a bottleneck. |
| Time in Mailbox | Avg time a message spends in the mailbox to be processed per actor class. Long times in mailbox can indicate a processing bottleneck. |
| Actor Processing Times | Avg message processing times per actor class. High numbers can indicate extensive workflows or long processing times of single elements or a combination. |
| Job Manager Actor Processing Times | Avg processing times for Job Manager Actor. In Kolibri, each submission of new job creates a new Job Manager Actor which handles distribution of batches across the nodes. |
| Runnable Execution Actor Processing Times | Avg processing times for Runnable Execution Actors. Those actors start the RunnableGraph on the single nodes, which means executing a single batch. |
| Aggregating Actor Processing Times | Avg processing times for Aggregating Actors. For each batch execution as executed by a Runnable Execution Actor there is one Aggregating Actor to aggregate the single results to an overall per-batch result |
| Requests/min | Client requests to external systems in /min avg |
| Client Request Time | The time needed by the requested external service to answer the requests sent by Kolibri. |
| CPU Load | Avg, Min, Max CPU Load of the whole cluster |
| Nr of GCs | Number of occurring GCs |
| Avg GC times | Avg time a single GC ran |
| GC time | Overall avg time spent in GC |
| JVM memory | Overview of memory boundaries and used memory per node |
